Unbalanced Forces Lab
Researchers: Emmy Xu, Elle Grillo, Jongwoo Park
Lab Conducted On: October 21, 2021

Experimental Design
This experiment aimed to answer two questions:
1. How does the acceleration of an object depend on the net force acting on it?
2. How does the acceleration of an object depend on the mass of it?
Experimental design for Question #1:
Independent variable: net force (N)
Dependent variable: acceleration (m/s^2)
Controls: total mass of the system, planet, track, cart
In this set up, the mass of the cart was gradually decreased while the mass of the hanger gradually increased, and the combined mass of the hanger and the cart stayed constant throughout the experiment. Given the equation (Net Force = mass x acceleration), it was essential to maintain a constant mass throughout the experiment to ensure that the only two variables in play were the acceleration and the net force.
Experimental design for Question #2:
Independent variable: mass (kg)
Dependent variable: acceleration (m/s^2)
Controls: net force, planet, track, cart
In this set up, the mass of the cart was gradually increased while the mass of the hanger stayed the same throughout the experiment, and the combined mass of the hanger and the cart increased throughout the experiment. Given the equation (Net Force = mass x acceleration), it was essential to maintain a constant net force throughout the experiment to ensure that the only two variables in play were the acceleration and the mass.
Method - Procedure
Experiment #1 - METHOD:
The method of data collection for this experiment mainly involved the use of Logger Pro's motion sensor software to track and graph the velocity of the cart for the various amounts of net force exerted on it, and from there, using Logger Pro's graphing analysis software to find the acceleration of the cart by evaluating the slopes of the various velocity graphs. For all trials, a 1 kg mass was added to the cart for added stability. The combined mass of the 1 kg mass and the cart was 1.5 kg. The total mass of the system (cart + 1 kg mass + hanger mass + added cart mass) for all trials was 1.68 kg throughout the experiment. There were a total of five trials conducted with different variations of hanger mass and added cart mass.
Experiment #1 - PROCEDURE:
1. Add .05 kg mass to the hanger and .13 kg mass to the cart.
2. Hit "collect" in Logger Pro to start recording data.
3. Release the cart at the same time that the hanger is released.
4. Stop the cart before it reaches the pulley.
5. Save the data collected in Logger Pro.
6. Evaluate slope of velocity graph to determine acceleration.
7. Repeat steps 1-6 for the four other hanger mass - added cart mass combinations.
Experiment #2 - METHOD:
The method of data collection for Experiment #2 was similar to that of Experiment #1. Once again, Logger Pro was used for graphing and analyzing. Differing from Experiment #1, in this experiment, the hanger mass stayed constant throughout the experiment at .05 kg; there was no mass added to the hanger. The only mass that was changed was the mass added to the cart. A total of thirteen trials were conducted with varying masses added to the cart. The net force of the hanger was kept constant throughout the experiment -- calculated by multiplying the mass of the hanger (.05 kg) x the acceleration of the hanger (9.8 m/s^2) = .49 N.
Experiment #2 - PROCEDURE:
1. Add .01 kg mass to the cart.
2. Hit "collect" in Logger Pro to start recording data.
3. Release the cart at the same time that the hanger is released.
4. Stop the cart before it reaches the pulley.
5. Save the data collected in Logger Pro.
6. Evaluate slope of velocity graph to determine acceleration.
7. Repeat steps 1-6 for the twelve other added mass values.
![0001[1]_edited.jpg](https://static.wixstatic.com/media/b74959_bb0bb80387b647c182c04270c87b16a7~mv2.jpg/v1/fill/w_980,h_432,al_c,q_85,usm_0.66_1.00_0.01,enc_avif,quality_auto/b74959_bb0bb80387b647c182c04270c87b16a7~mv2.jpg)
Exp.1 -- Raw Data

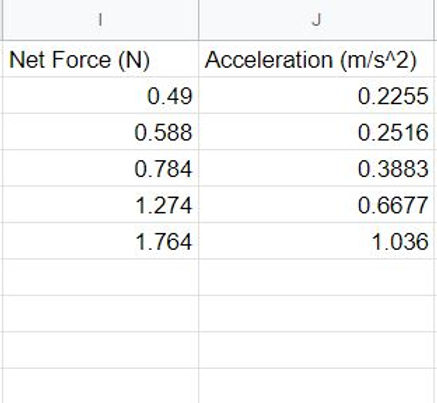
Exp. 1 - Processed Data:
The net force values in this table were produced by multiplying the mass of the hanger by the acceleration of the hanger (Net force = mass x acceleration). For example: .49 N = .05 kg x 9.8 m/s^2. The acceleration values in this table were produced using Logger Pro's graphing analysis tool. The slope of the velocity time graph for each trial was evaluated and recorded.
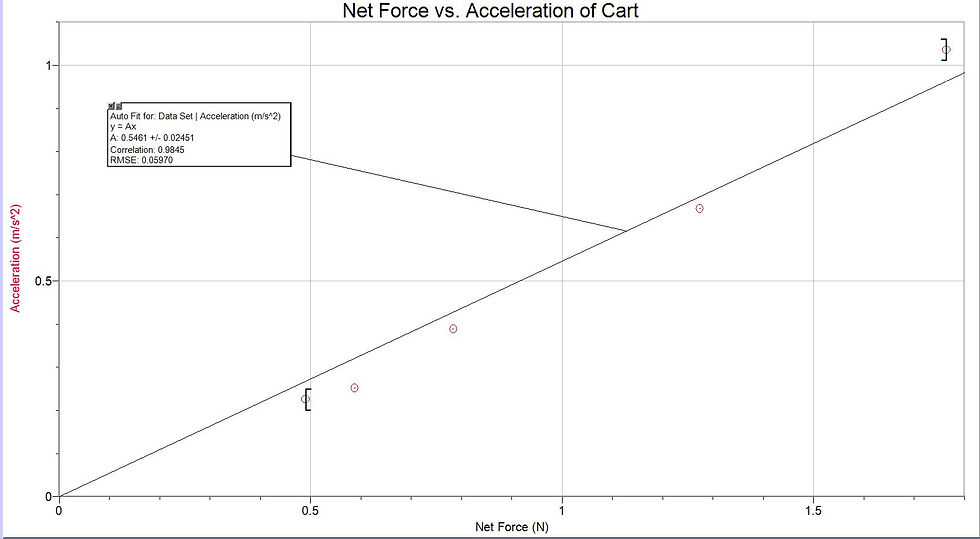
Exp.1 -- Graphical Analysis
A proportional relationship chosen to represent this graph:
Acceleration = .5461 (Net Force)
The slope of this graph (.5461) indicates that for every 1 newton of increase in the net force, the acceleration of the cart is predicted to increase by .5461 meters per second squared. There is a positive, linear relationship between net force and acceleration, meaning that increasing the net force would lead to a proportional increase in acceleration.
The y-intercept here is 0, given that it is a proportional relationship. This is logical given that if the net force exerted on the cart were 0, it would indicate that there are no unbalanced forces, and according to Newton's First Law, the object would not accelerate. Thus, a proportional graph best fits this relationship, as it accurately represents the fact that a net force of 0 means 0 acceleration as well.
Exp. 2 -- Raw Data

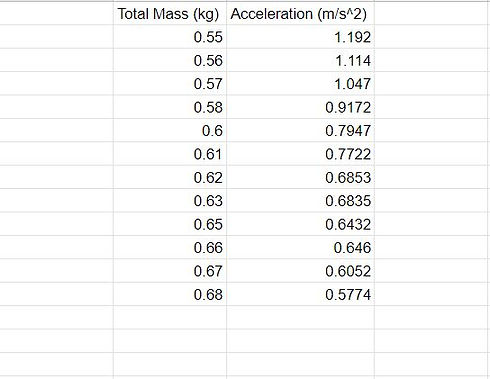
Exp. 2 -- Processed Data:
The total mass values in this table were produced by adding the mass of the cart itself and the added mass placed onto the cart for each trial. The acceleration values were determined by evaluating the slopes of the velocity time graphs produced by the motion sensor using Logger Pro's analysis software.
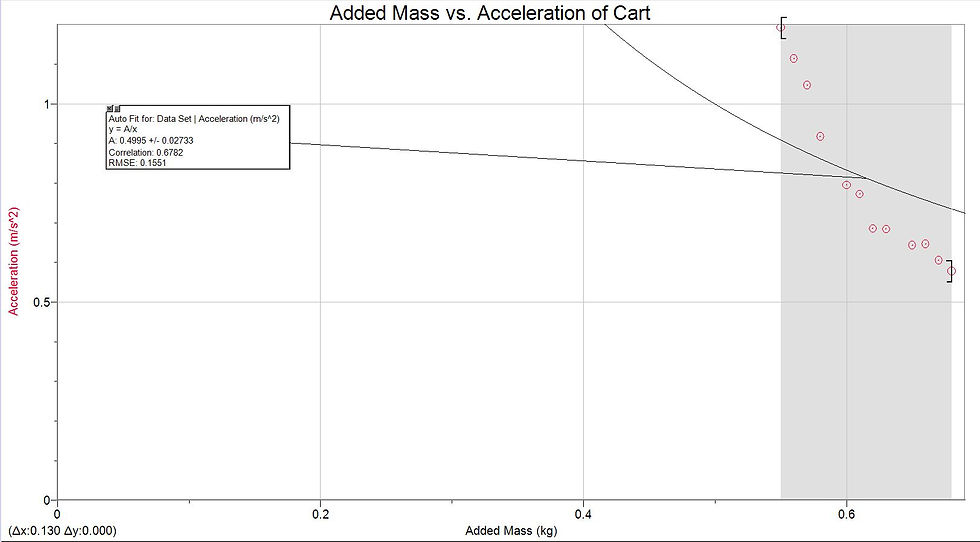
Exp. 2 -- Graphical Analysis
An inversely proportional relationship chosen to represent this graph:
Acceleration = .4995 / (Net Force)
The equation indicates that there is an inversely proportional relationship between total mass and acceleration. Additionally, the slope of the graph is consistently negative. These characteristics of the graph suggest that increasing the total mass would lead to a decrease in acceleration.
It should also be noted that the inverse graph ensures that there is not a y-intercept. Logically, this makes sense in the context. To have a y-intercept would indicate that a cart with a total mass of 0 could accelerate, which is impossible.
Conclusion - Evaluation - Improvement
EXPERIMENT 1 -- Conclusion:
The purpose of this experiment was to identify the relationship between the net force acting upon an object and the acceleration of that object. From this experiment, it can be concluded that there is a positive, proportional relationship between net force and acceleration. The results of this experiment support the component of Newton's Second Law of Motion that states that the acceleration of an object depends directly upon the net force acting upon that object. In this experiment, the total mass of the system was kept constant while the net force was gradually increased, and from there, a proportional increase in acceleration was observed as well: .5461 meters per second squared for every newton of increase in net force.
EXPERIMENT 2 -- Conclusion:
The purpose of this experiment was to identify the relationship between the total mass of the object and the acceleration of that object. From this experiment, it can be concluded that there is an inversely proportional relationship between mass and acceleration. The results of this experiment support the component of Newton's Second Law of Motion that states that the acceleration of an object depends inversely on the mass of the object. In this experiment, the net force was kept constant while the mass of the cart was gradually increased, and from there, an inversely proportional decrease in acceleration was observed.
Evaluating Procedures:
The first greatest source of uncertainty in this lab is the range selected on the velocity-time graph from which acceleration values were determined. When deciding on how large or small of a range to include in finding the slope of the graph, we relied mainly on human judgment. This could definitely contribute to variability, if not inaccuracy, within the acceleration values collected. Ideally, the range selected each time would be uniform for each trial.
The second greatest source of uncertainty in this lab is the starting and stopping of the car. The person starting and stopping the car and the person handling the hanger both potentially influence the collected data by exerting an outside force onto the cart or hanger when they release the objects. This outside influence could lead to inaccuracies within the collected data.
Improving the Investigation:
The most effective way to improve the investigation would be to conduct a larger number of trials. The effects of both sources of inaccuracies mentioned previously can be significantly mitigated by collecting more data. A larger amount of data would produce patterns that are more reliable given that the effects of variability within range selections and outside forces are minimized when there is a larger set of data to work with.